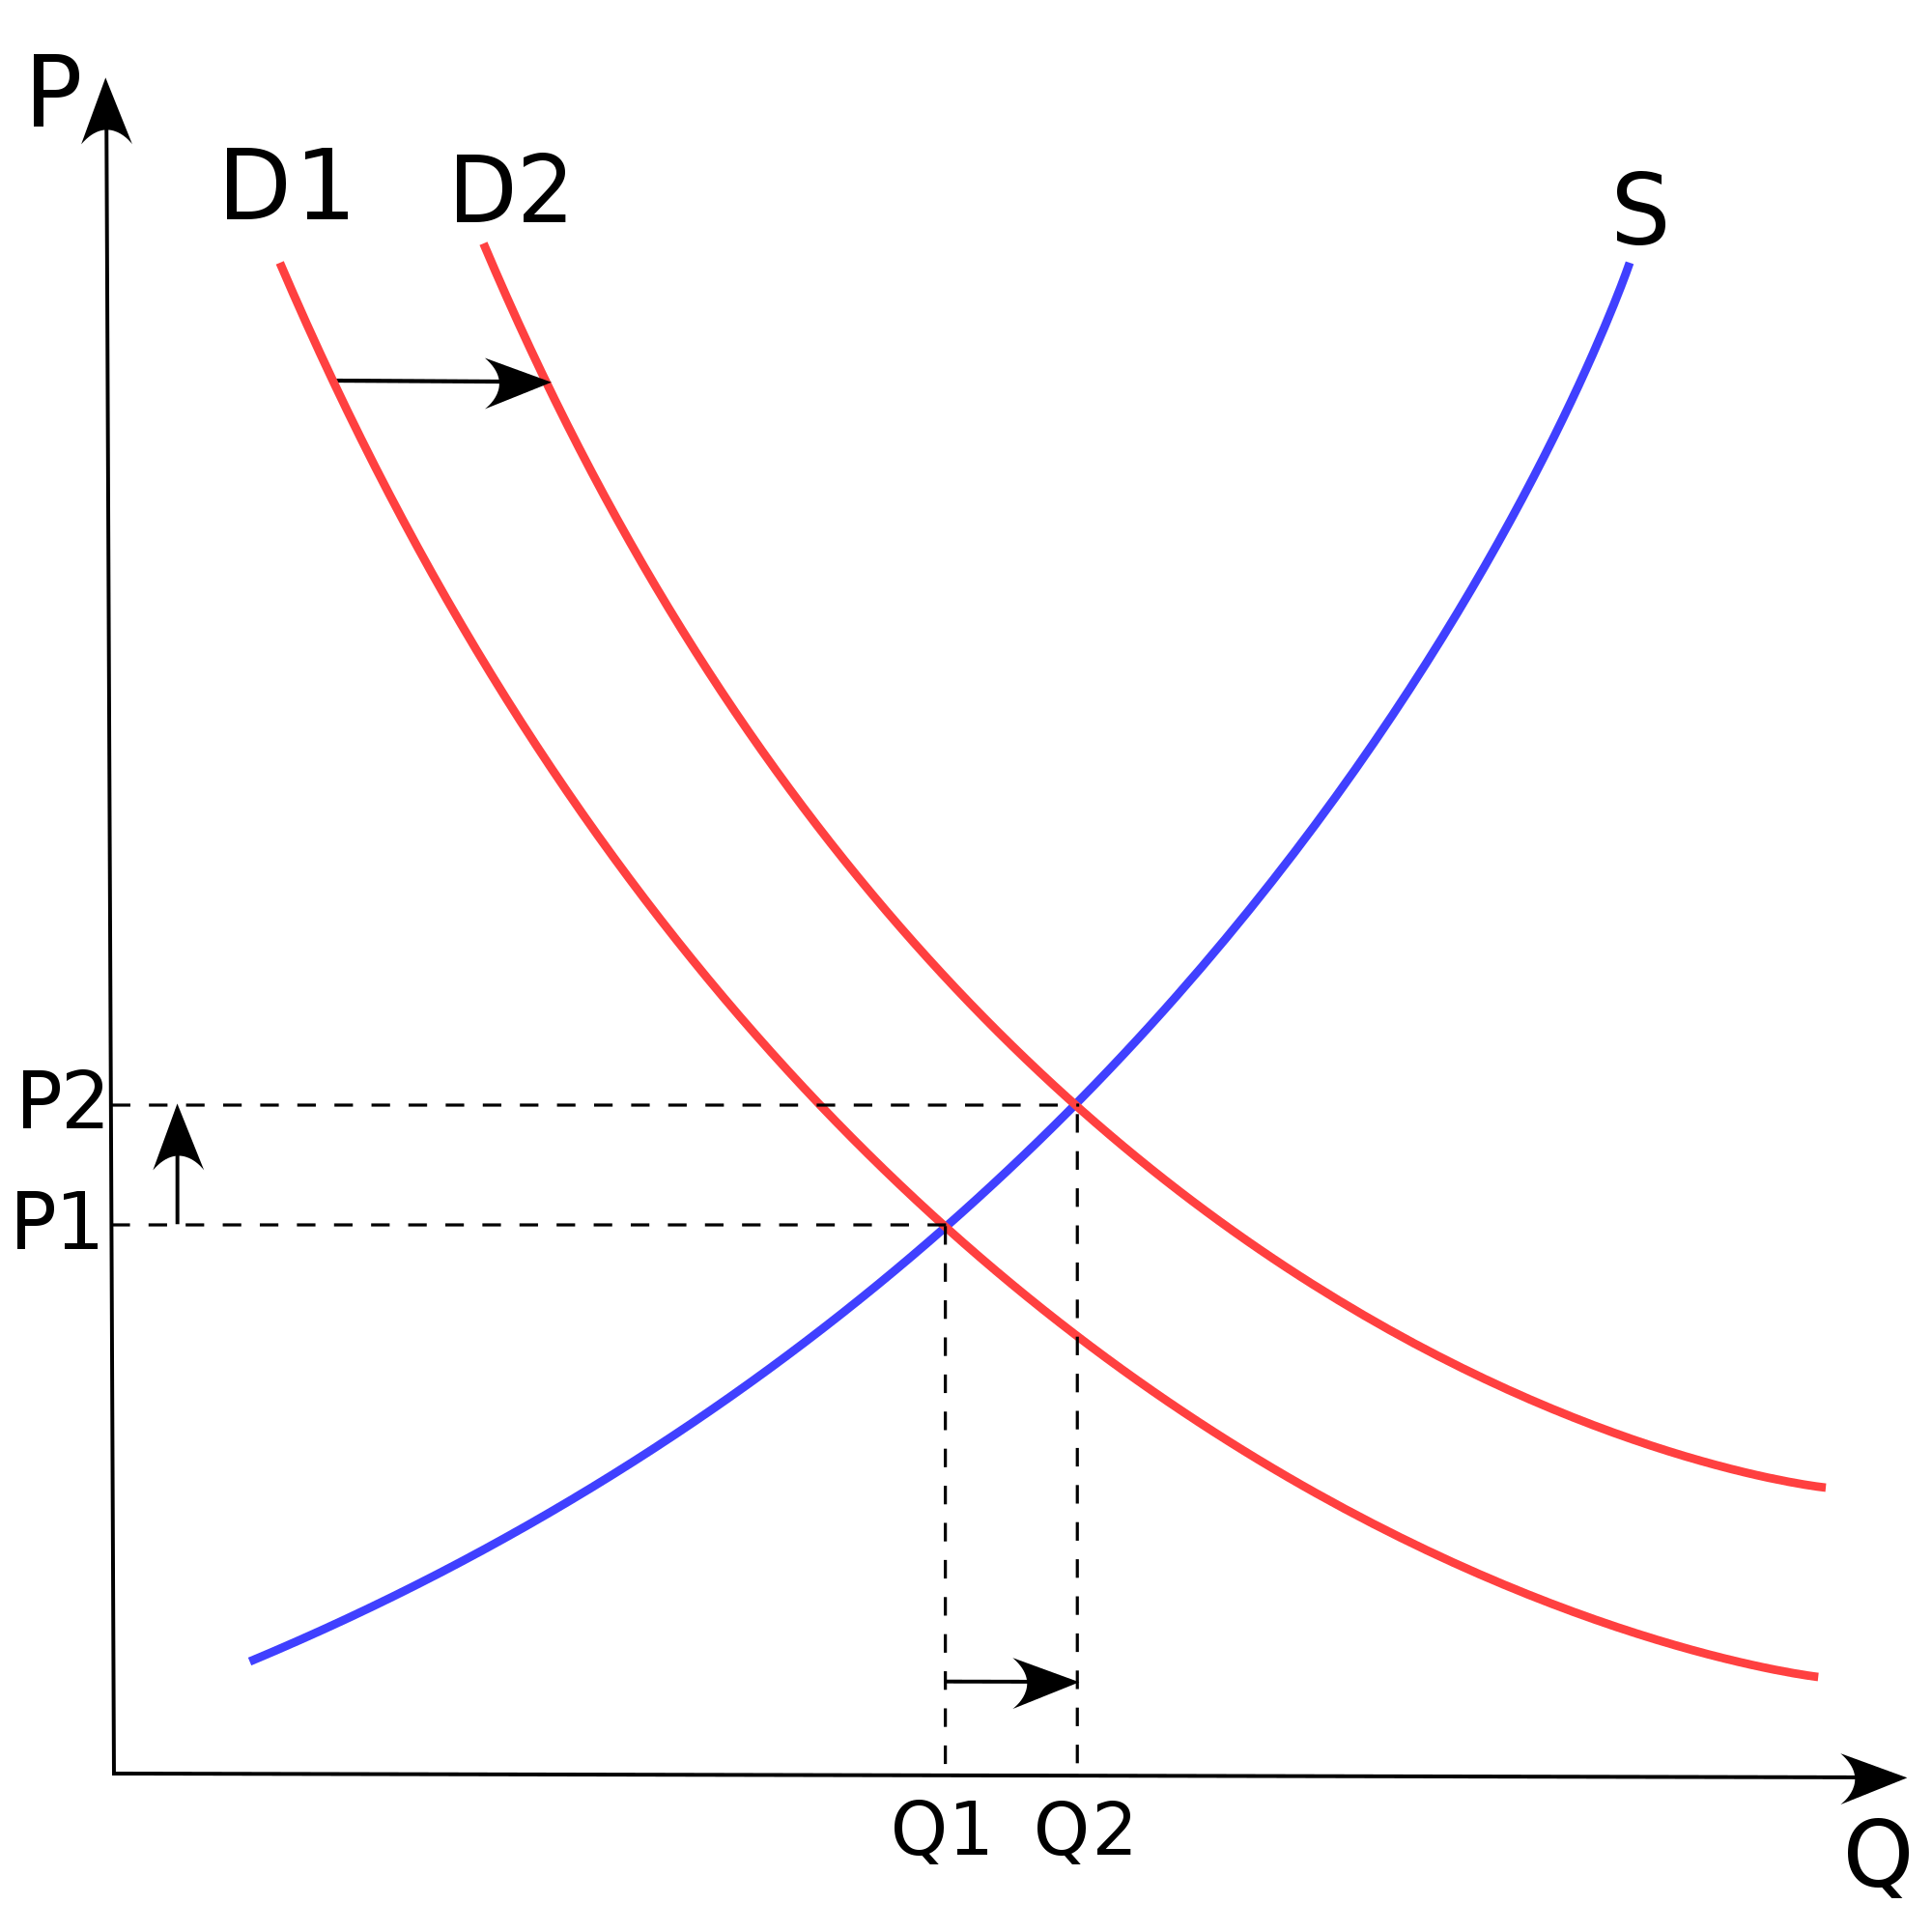

SUPPLY AND DEMAND GRAPH:
plot your P1 and Q1. connect where they meet. then repeat with P2 and Q2.
surplus = QS > QD
quantity supplied greater than quantity demand.
shortage = QD > QS
quantity demand greater than quantity supplied.
equilibrium - point in which supply and demand intersect at this point, resources are used efficiently.
at any time resources not used efficiently, you have disequilibrium.
price floor - the top of the surplus area. it's a line. government imposed price control on how low someone can change for a service.
EX. minimum wage
price ceiling - bottom of the shortages area. government imposed price control on how high a price can be change for a product or service.
EX. rent control. San Fran, CA ; NYC, NY


Your posts are organized and the information is presented in a brief and clear manner. I particularly like the graphs that you chose here to illustrate the concepts of supply, demand, and equilibrium.
ReplyDeleteThis graph really helps me understand the concept more, Thanks Hanh!
ReplyDeleteThe pictures provided a visual representation of the concept including all the components of the graphs and allowed me to fully grasp the concept of supply an demand graphs. I appreciate how neat and organized your notes are and how they are just straight to the point.
ReplyDeleteYour notes are very organized & I like how you put the graphs for visual aid. Its a very good idea, & it helps others understand the concept better than just reading the notes.
ReplyDelete